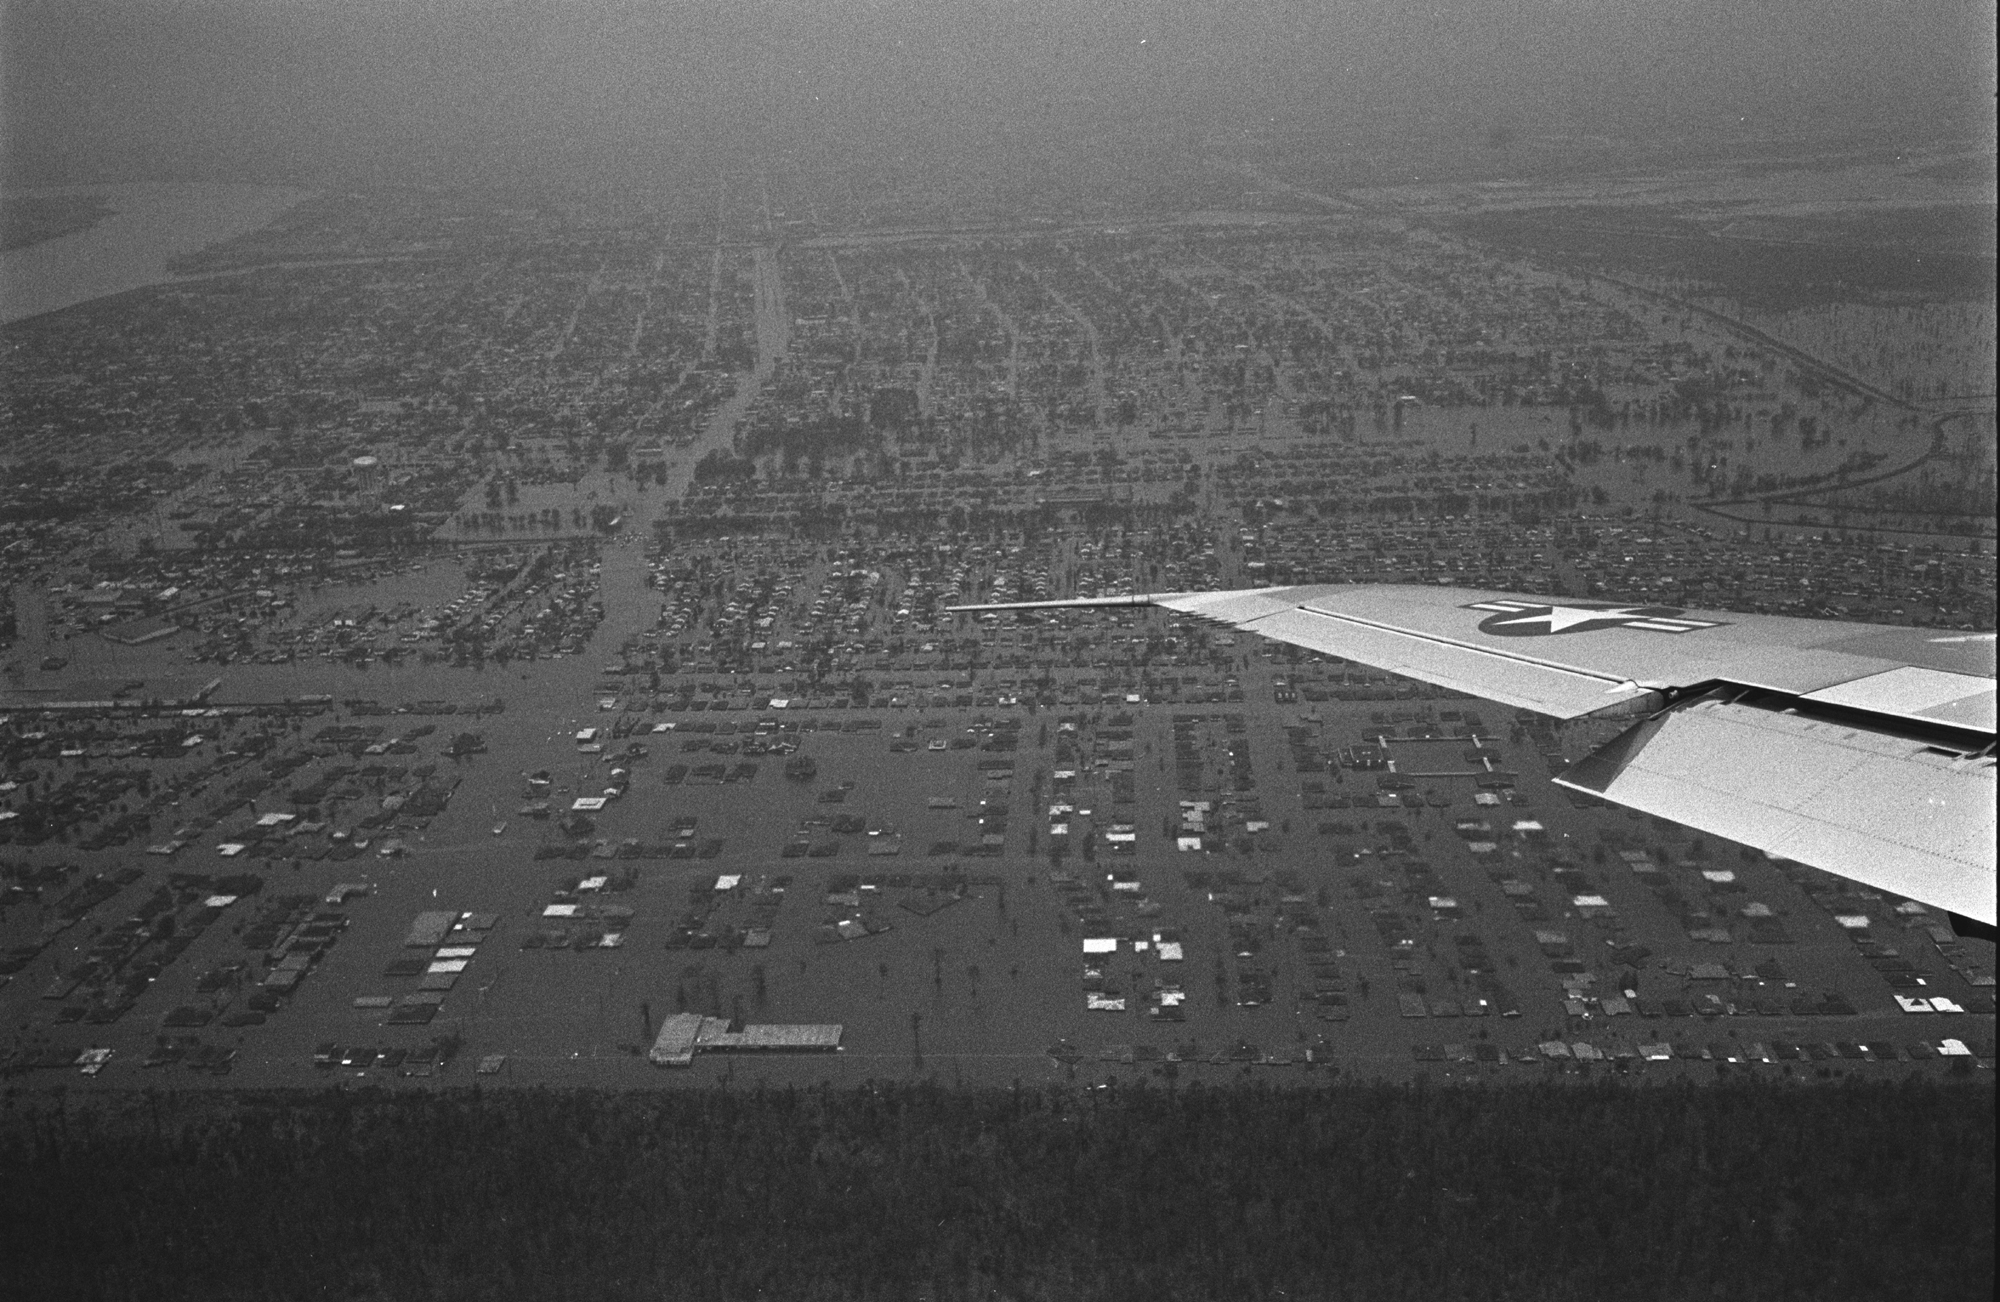
Incredible aerial shot of the flooding in New Orleans after Katrina.
Source: US Coast Guard
I vividly remember the horrible, sick feeling I got as I watched Hurricane Katrina take aim at the Gulf Coast ten years ago. It was like watching a train wreck in slow motion. You knew lots of people were going to die and there was nothing you could do to stop it. It’s a horrible, helpless feeling. Watching the news coverage of the devastation was incredibly surreal. It reminded me of how I felt on 9/11. You feel almost detached, almost as if your mind refuses to believe what your eyes are seeing. “This can’t possibly be happening,” but it is. I’ve often said meteorology is a very humbling field. As meteorologists, we try very hard to see these things coming, but no matter how good technology gets, we can only do our best to predict and understand these events…we can’t stop them. Nature and its fury never fail to remind us of our humanity and our mortality.

A map of the original French settlement at New Orleans, centered on the modern-day French Quarter.
Source: US Census Bureau
Scientists had been warning for years that New Orleans was at serious risk for a major disaster. The handwriting was arguably on the wall. The city was founded in 1718 by French colonists. It was a strategic location along the Mississippi River and was in fact on comparatively high ground compared to the surrounding area. It’s worth pointing out that the elevated area in and around the French Quarter, which was originally the primary settlement, escaped the worst of the flooding in Katrina and sustained relatively little damage. The city’s first major storm hit in 1722, when the Mississippi River rose eight feet and numerous buildings were destroyed. At the time, Biloxi, Mississippi was the capital of France’s Louisiana colony but there was a push to move it to New Orleans because of its strategic location and its rise as a port of importance. The destruction of the hurricane of 1722 led to serious fears about the city’s future and there was significant opposition to the move. Nevertheless, the capital was moved to New Orleans just two years later.

Explorer and astronomer William Dunbar made revolutionary observations during the hurricanes of 1779 and 1780 in New Orleans.
In 1779, 190 years to the day before Hurricane Camille obliterated the Mississippi coast, another significant hurricane struck New Orleans. Louisiana had come under Spanish rule 17 years earlier and Spain had just declared war on Britain. An entire fleet of Spanish ships (save for one) was sunk offshore and numerous ships in New Orleans harbor were thrown well inland. Numerous buildings were leveled, but the city escaped widespread flooding. Scottish explorer and astronomer William Dunbar made a groundbreaking discovery during this storm, correctly theorizing that a hurricane was an independent, progressive-moving storm that rotated around a central vortex. It took a while before this theory was accepted by mainstream science, but Dunbar’s observations proved to be a pioneering meteorological discovery. Another, even worse hurricane hit the following year, sinking every ship on area waters and leveling much of the city. During that storm, Dunbar first observed that hurricanes can produce tornadoes and that such tornadoes tend to be short lived. Just eight years later, much of the city would be destroyed by fire.

A modern reconstruction of the track of the 1812 hurricane based on historical observations.
Source: Mock et. al. (2010)
In 1812, as the eponymous War of 1812 was getting started, an estimated Category 3 hurricane slammed into the delta southeast of New Orleans. Up to 15 feet of water flooded parts of New Orleans and adjacent Plaquemines Parish (where 45 people drowned). However, the 1812 hurricane was much smaller and weaker than Katrina, and rising sea levels and erosion of the delta have greatly increased the danger to the city. In 1831, a powerful hurricane struck central Louisiana, wiping out the village of Barataria south of New Orleans. Lake Pontchartrain burst its banks and flooded northern sections of New Orleans proper. 260 people were killed in the state, 150 in Barataria alone. Six years later, a Category 2 hurricane dubbed “Racer’s Storm” raked the southern Louisiana bayous on an almost west-to-east path. An eight-foot surge into Lake Pontchartrain caused 1-2 feet of water to flood most of New Orleans. Damage in the city was extensive in places, but not major.

The Bruning Grocery store near the shore of Lake Pontchartrain inundated by four feet of water following the 1909 hurricane.
Source: New Orleans Daily Picayune
New Orleans largely escaped the devastating 1856 hurricane that wiped out the resort island of Isle Derniere (Last Island), 75 miles southwest of New Orleans, and killed 400 people. The city again escaped when the state’s worst hurricane in history devastated the bayous of Jefferson and Plaquemines Parishes south of the city in early October, 1893. Several towns were completely wiped out. The village of Chenier Caminada was particularly hard hit, with 779 of its 1,500 residents being killed. In 1909, the city wasn’t so lucky. On September 20, a Category 3 roared over the bayous of Terrebonne Parish southwest of the city. The hurricane devastated rural communities across coastal Terrebonne Parish, where 200 people were killed. Grand Isle has been mistakenly reported to have been destroyed by this hurricane. Storm surge flooding of up to two feet was reported on the island but damage was minor. Lakes around New Orleans burst their banks, flooding the city. The city’s low-lying west side saw the worst of it, with some areas flooded in up to ten feet of water. At the time, however, those areas weren’t heavily developed. That combined with timely warnings (forecasts ahead of this storm were exceptionally good for that day and age) prevented a more devastating human catastrophe. 353 people died in the hurricane in Louisiana.

Wind damage from the 1915 hurricane was severe.
In 1915, the city was hit again. A strong Category 3 not much weaker than Katrina slammed into the southern coast west of Grand Isle on September 29. Plaquemines Parish was devastated. Over 200 people died in the parish, many of whom were never found, and miles of levees were wiped out. In Lafourche Parish, the town of Leeville was leveled and surrounding areas also suffered major damage. A 13 foot storm surge rushed into Lake Pontchartrain and caused parts of New Orleans to flood. It wasn’t as bad as the 1909 storm. The worst of it was in the Mid-City neighborhood after pumps failed. Worse flooding occurred east of New Orleans in St. Bernard Parish. However, the city was rocked by winds that gusted up to 98 mph, causing widespread major wind damage.

Moissant Airport was underwater after the 1947 hurricane.
Source: US Army Corps of Engineers
After that, things got quiet. The city grew and developed, with residential neighborhoods sprawling down off the high ground and into the flood plains surrounding the old city. After the 1915 hurricane, the levees were strengthened and no more floods came. Residents of New Orleans had faith that the levees would hold. The first warning came in 1947. After striking south Florida as a Category 4, a Category 2 hurricane plowed into Black Bay southeast of New Orleans. Low-lying areas of the city suffered relatively minor but widespread flooding. Moissant Airport on the shore of Lake Pontchartrain was under two feet of water. The warning was heeded and again the levees were strengthened, this time with help from Congress. The lakeshore levee and the Orleans Seawall were both increased in height and a new eight foot levee was built along the Jefferson Parish lakeshore. But it wasn’t enough.

This spectacular aerial view of the Lower Ninth Ward after Betsy bears a chilling resemblance to the aftermath of Katrina.
Source: Lyndon B. Johnson Presidential Library
The most terrifying foreshadowing came in 1965. Hurricane Betsy slammed into southeastern Louisiana as a strong Category 4 on September 10. A ten foot storm surge rushed into Lake Pontchartrain, causing the lake and the city’s deepwater canal (called the Mississippi River Gulf Outlet) to burst their banks. Levees along the Outlet and the Industrial Canal failed and large sections of the Ninth Ward and Gentilly were inundated…exactly what happened during Katrina 40 years later. On the south side, the Mississippi River rose over ten feet, causing additional flooding. New Orleans Mayor Vic Schiro was widely hailed for his actions in preparation for Betsy as well as during relief efforts that helped prevent an even more devastating disaster. In the aftermath of Betsy, the levees were heavily renovated by the Army Corps of Engineers. The levees were rebuilt of a stronger material and up to twelve feet higher. They were also expanded in many areas. The Corps had planned to build a large hurricane barrier on the south side of Lake Pontchartrain as an extra measure of protection for the city, but they were sued by an environmental group concerned about preserving area wetlands. To avoid a protracted legal battle, the Corps scrapped the project. It was a decision that would haunt them.

This graphic shows how the storm surge caused the levees and floodwalls in New Orleans to fail.
Source: Tulane University
The reinforcements made after Betsy were in line with the available technology at the time but did not account for the exacerbating effects of a slow-moving storm. Betsy was powerful but moved very quickly. Surge is less driven by the force of the winds and more by the size of the storm, speed of motion, direction to the coast, and the shape of the coastline. This destructive potential was made abundantly clear by Hurricane Georges in 1998, which despite being only a Category 2 and hitting east of New Orleans in Mississippi (keeping the city on the storm’s weaker west side), floodwaters nearly overtopped the levees in places.
In 2001, FEMA commissioned a number of studies on hypothetical disasters, among them a terrorist attack in New York City and a hurricane disaster in New Orleans. The idea of the hurricane barrier was revisited, but the cost was considered prohibitive and the belief was that it would take a 500-year event to breach the existing levee system. Whenever there is a major disaster, it’s always easy to look back and see the warning signs and what we should or should not have done. Hindsight, as they say, is 20-20. FEMA’s greatest failing was most likely its philosophy of reactivity versus proactivity. There wasn’t a system in place for responding to 500-year events or enough emphasis on coordination between local governments and the federal government. However oftentimes our harshest lessons are also the most valuable.

The hard lessons from Katrina prepared us for the havoc unleashed by Sandy.
Source: Daily Mail (UK)
In the years after Katrina we applied those lessons and in October of 2012, those changes were put to the test. Hurricane Sandy was an unprecedented event. Meteorologists who’d been in the business for 50 years had never seen anything like it. Like New Orleans, scientists had been warning for years about the dangers of a hurricane impacting New York City and the Jersey Shore. NYC sits at the peak of a concave coastline, which acts to greatly enhance the storm surge by focusing it on a single point. And there you have tens of millions of people all crammed together on low-lying, flood-prone coastline. It was a worst-case scenario. The Jersey Shore was devastated and New York City saw unprecedented flooding, with damage estimated at $68 billion, making it the second costliest hurricane in history behind Katrina. The death toll in the US was 157, which to me is a borderline miraculous number. I don’t think people appreciate just how easily that number could’ve been in the thousands. Outstanding local leadership and governmental cooperation saved untold lives. I think a lot of that can be attributed to the fundamental changes made in the wake of Katrina. Sandy was a beautiful example of hard lessons beautifully applied to prevent another cataclysm. The material damage was great, but most people lived to pick up the pieces. Things can be replaced, lives can’t. And at the end of the day, that’s one of meteorologists’ greatest responsibilities: keeping people safe from the worst nature has to offer.